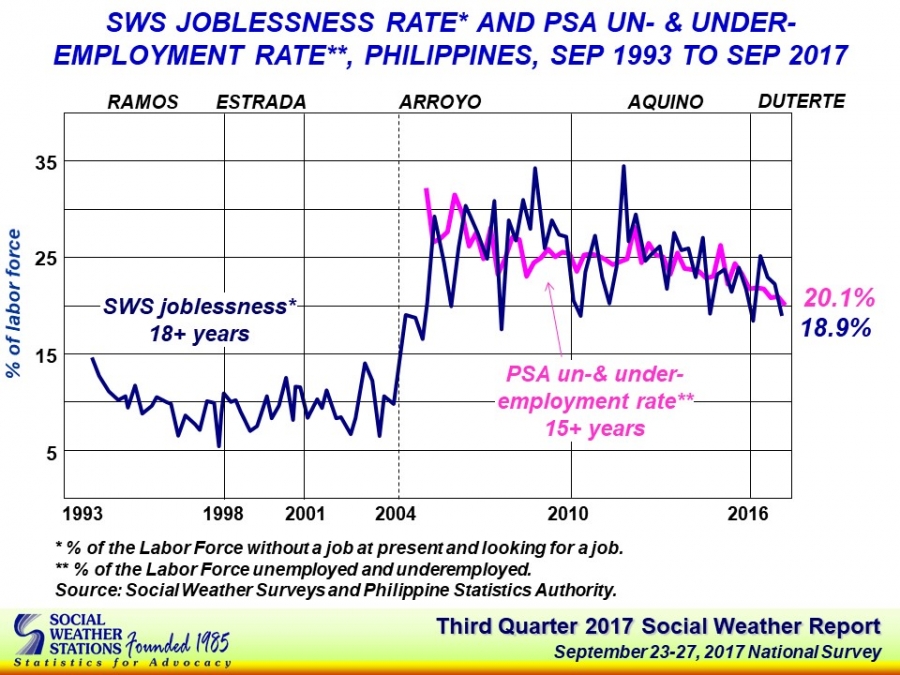
The Third Quarter 2017 Social Weather Survey, done on September 23-27, 2017, found adult joblessness at 18.9% (corresponding statistically to an estimated 8.7 million adults).
This is 3.3 points below the 22.2% (est. 10.5 million adults) in June 2017, and is the lowest recorded joblessness rate since the 18.4% in September 2016.
The September 2017 adult joblessness rate consisted of those who voluntarily left their old jobs, at 10.4% (est. 4.8 million adults); those who involuntarily lost their jobs, at 6.6% (est. 3.1 million adults); and first-time job seekers, at 1.9% (est. 860,000 adults).
SWS’s adult joblessness data refers to adults in the labor force. Those with a job at present, plus those without a job at present and looking for a job, are part of the labor force.
The September 2017 survey found the adult labor force participation rate at 73.1%, or an estimated 46.1 million adults. This is a 1.6% decrease from the 74.7% (est. 47.1 million adults) labor force participation rate in June 2017.
The September 2017 survey also asked, “Sa darating na 12 buwan mula ngayon, sa palagay ba ninyo ay DADAMI, HINDI MAGBABAGO, o MABABAWASAN ang trabaho na maaaring pasukan?” [“Twelve months from now, do you think there will be MORE JOBS, NO CHANGE in available jobs, or FEWER JOBS?”].
Optimism that there will be more jobs decreased by 1 point from 46% in June 2017 to 45% in September 2017, while pessimism that there will be fewer jobs rose by 3 points from 15% in June to 18% in September. The proportion of those who say there will be no change in job availability fell by 3 points from 30% in June 2017 to 27% in September 2017.
This downgrades the Net Optimism on Job Availability score (% more jobs minus % fewer jobs) by 3 points from the very high +31 in June 2017 to a high +28 in September 2017.
The SWS terminology for Net Optimism on job availability: +30 and above, “very high”; +20 to +29, “high”; +10 to +19, “fair”; +1 to +9, “mediocre”; -9 to zero, “low”; -10 and down, “very low.” SWS considers movement from one classification to another as either an “upgrade” or “downgrade.”
Profiles of the jobless
Adult joblessness consists of (a) those who voluntarily left their old jobs, (b) those who lost their jobs due to economic circumstances beyond their control, termed as the retrenched, and (c) those seeking jobs for the first time.
The proportion of those who resigned or left their old jobs voluntarily fell by 1.8 points, from 12.1% in June 2017 to 10.4% in September 2017.
Those who were retrenched rose by 0.5 points, from 6.1% in June to 6.6% in September.
The 6.6% who were retrenched consisted of 4.1% whose previous contracts were not renewed, 1.7% who were laid off, and 0.9% whose employers closed operations.
The proportion of first-time job seekers fell by 2.1 points, from 3.9% in June to 1.9% in September.
Joblessness falls among women
Adult joblessness among women fell by 4.9 points from 31.5% in June 2017 to 26.5% in September 2017. This is the lowest figure among women since the 26.1% in September 2017. [Chart 5, Table 3].
Among men, adult joblessness decreased by 1.8 points from from the 15.2% in June to the 13.5% in September. It has been below 20% since March 2014.
Joblessness falls among all age groups below 45
Adult joblessness fell by 10.6 points among 18 to 24 year olds, from 60.8% in June 2017 to 50.2% in September 2017. It was 47.3% in March 2017 [Chart 6, Table 4].
It also fell by 10.4 points among 25 to 34 year olds, from 31.7% in June to 21.3% in September.
It decreased by 4.1 points among 35 to 44 year olds, from 17.0% in June to 12.8% in September.
However, it increased by 3.8 points among those 45 years old and above, from 9.9% in June to 13.8% in September.
SWS Joblessness versus Labor Force Survey (LFS) Unemployment
The SWS data on joblessness refers to the population of adults in the labor force. This is because respondents in the standard SWS surveys are those at least 18 years old.
On the other hand, the official lower boundary of the labor force has always been 15 years of age.
In the SWS surveys, persons with jobs are those who have a job at present (“may trabaho sa kasalukuyan”), including unpaid family workers. The question does not use any past reference period. The SWS joblessness figures are consistently based on the traditional definition of joblessness as fulfilling two requirements: without a job at present and looking for a job. Those without a job but not looking for one, such as housewives, retirees, differently abled, and students, are excluded from the labor force.
On the other hand, the official Labor Force Survey (LFS) definition of employed include all those who, during the week before the interview date, are 15 years and over as of their last birthday and are reported to be either:
At work. Those who do any work for at least one hour during the reference week for pay or profit, or work without pay on the farm or business enterprise operated by a member of the same household related by blood, marriage, or adoption; or,
With a job but not at work. Those who have a job or a business but are not at work because of temporary illness/injury, vacation, or other reasons. Also, persons who expect to report for work or to start operation of a farm or business enterprise within two weeks from the date of the enumerator’s visit are considered employed.
Before April 2005, the official definition of the unemployed was those who did not work during the reference week and are looking for work. However, from April 2005 onwards, the official definition was refined as follows: not working, looking for work, and available for work. It subtracts those who are looking but not available for work and adds those available but not looking for work for the following reasons: tired/believe no work is available, awaiting results of a job application, temporarily ill/disabled, bad weather, and waiting for rehire/job recall.
In the past, SWS has compared its Joblessness rate with PSA’s Unemployment rate. However, given the conceptual differences between SWS and PSA’s definitions of employment (e.g., age range, reference period, etc.), there has been an understandably large discrepancy between PSA’s Unemployment rate and SWS’s Joblessness rate. For example, SWS directly asks if the respondent has work at present, whereas PSA specifies a minimum of one hour of work to be counted as employed. The leniency of this requirement made it very easy to be officially employed.
To address this, PSA’s Unemployment and Underemployment rates have been combined and expressed as a proportion of the Labor Force. The resulting statistic allows for more conceptually and statistically comparable rates with SWS’s Joblessness rates, as it combines PSA respondents who are unemployed and those who wish to work beyond the minimum of one (1) hour. This yields a more accurate picture of the labor situation in the Philippines.
The mathematical representations used in recomputing PSA’s Unemployment and Underemployment rates are shown. Note that to avoid confusion, the Unemployment Rate has been termed as Idle Unemployment.
To get the rate of the Underemployed as a proportion of the Labor Force, the rate of the Idle Unemployed is subtracted from the total Labor Force. The result, the rate of the Employed as proportion of the Labor Force, is multiplied by the rate of Underemployment. The result is the rate of the Underemployed expressed as a proportion of the Labor Force.
When added to the rate of the Idle Unemployed, this results in the PSA Combined Unemployment and Underemployment rate. This proportion is more comparable to the SWS data on Joblessness.
This means that if the availability requirement is included, adult unemployment in September 2017 was 12.0% (est. 5.1 million adults). That is, 11.9% (est. 5.0 million adults) who were not working, looking for work, and available for work and 0.1% (est. 29,000 adults) who were not working, not looking for work due to the reasons mentioned above, but available for work.
Therefore, among the 8.7 million adults who were jobless and were looking for work, 41.6% (est. 3.6 million adults) were not available for work at present or in the next two weeks.
Survey Background
The September 2017 Social Weather Survey was conducted from September 23-27, 2017 using face-to-face interviews of 1,500 adults (18 years old and above) nationwide, 600 in Balance Luzon and 300 each in Metro Manila, the Visayas and Mindanao (sampling error margins of ±3% for national percentages, ±4% for Balance Luzon, and ±6% each for Metro Manila, the Visayas and Mindanao).
The area estimates were weighted by Philippine Statistics Authority medium-population projections for 2017 to obtain the national estimates.
The quarterly Social Weather Surveys on joblessness are not commissioned, but are done on SWS’s own initiative and released as a public service.


