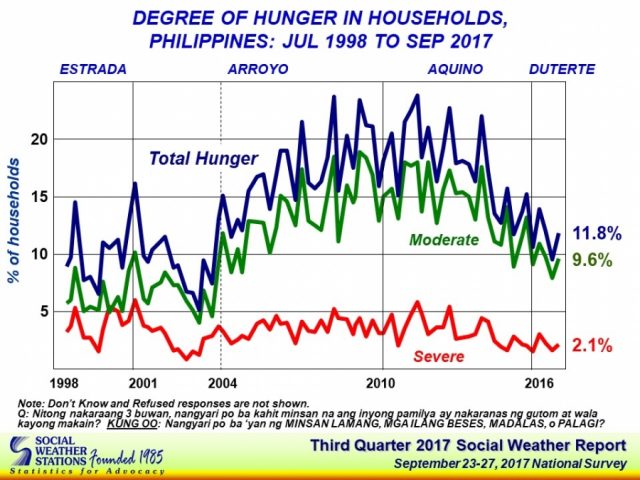
The Third Quarter 2017 Social Weather Survey, conducted from September 23-27, 2017, has found 11.8% (or an estimated 2.7 million families) experiencing involuntary hunger at least once in the past three months.
The measure of Hunger refers to involuntary suffering because the respondents answer a survey question that specifies hunger due to lack of food to eat.
According to SWS, this is 2.3 points above the 9.5% (est. 2.2 million families) quarterly Hunger in June 2017. It is similar to the 11.9% (est. 2.7 million families) quarterly Hunger in March 2017.
Moderate and severe hunger also rise
The 11.8% quarterly Hunger in September 2017 is the sum of 9.6% (est. 2.2 million families) who experienced Moderate Hunger and 2.1% (est. 493,000 families) who experienced Severe Hunger.
Moderate Hunger refers to those who experienced hunger “Only Once” or “A Few Times” in the last three months, while Severe Hunger refers to those who experienced it “Often” or “Always” in the last three months.
The few who did not state their frequency of hunger were classified under Moderate Hunger.
Both Moderate Hunger and Severe Hunger increased between June 2017 and September 2017. Prior to this, both had been steadily declining since December 2016.
Moderate Hunger rose by 1.8 points, from 7.9% in June to 9.6% in September. This is similar to the 9.7% in March.
Severe Hunger rose by 0.5 points, from 1.6% in June to 2.1% in September. This is similar to the 2.2% in March.
Among self-rated poor and self-rated non-poor
The 2.3-point rise in quarterly Hunger rate amid the 3-point increase in Self-Rated Poor and the steady Self-Rated Food-Poor proportions between June 2017 and September 2017 was due to an increase in the incidence of Hunger among both the Self-Rated Poor and Self-Rated Non-Poor, as well as among both the Self-Rated Food Poor and Self-Rated Food Non-Poor.
From June 2017 to September 2017, quarterly Hunger (i.e., Moderate plus Severe) rose by 3.1 points among the Self-Rated Poor, from 13.6% in June to 16.7% in September. It also rose by 1.1 points among the Non-poor (Not Poor plus Borderline) over the same period, going from 6.3% to 7.4%. Prior to this, both values had been declining since December 2016.
It rose by 2.7 points among the Self-Rated Food-Poor, from 17.1% in June to 19.8% in September. It rose by 2.1 points among the Not Food-Poor/Food-Borderline, from 5.9% to 8.0%.
At any one point in time, quarterly Hunger among the Self-Rated Food-Poor is always greater than Hunger among the Self-Rated Poor.
Survey Background
The Third Quarter 2017 Social Weather Survey was conducted from September 23-27, 2017 using face-to-face interviews of 1,500 adults (18 years old and above) nationwide: 600 in Balance Luzon, and 300 each in Metro Manila, Visayas, and Mindanao (sampling error margins of ±2.5% for national percentages, ±4% for Balance Luzon, and ±6% each for Metro Manila, Visayas, and Mindanao).
Annual Hunger rates, or the annual averages, have a sampling error margin of ±1.5%.
The area estimates were weighted by Philippine Statistics Authority medium-population projections for 2017 to obtain the national estimates.
The SWS survey questions about the family’s experience of hunger are directed to the household head. These items are non-commissioned, and are always included on SWS’s own initiative and released as a public service.
Moderate Hunger refers to those who experienced hunger “Only Once” or “A Few Times” in the last three months, while Severe Hunger refers to those who experienced it “Often” or “Always” in the last three months.
SWS employs its own staff for questionnaire design, sampling, fieldwork, data-processing, and analysis, and does not outsource any of its survey operations.


